Welcome to Rev. Dr. M.L. Millere's Site:
It is, often, difficult for me to explain the interest I posess in helping to eliminate the problems of poverty. It reigns around the world with haunting familiarity. It is the most popular subject during time of political epediency and most unpopular when our elected constituent are expected to keep the promises so often faulted in pedeceeding campaigns. When you have served a nation that refuse, still, to recognize you as a citizen. When you live in a country that has segregated it's spiritual and moral concerns. When you can pass the homeless and not wander why there are no shelters in that community. When you can pass the begger and the partial-wholly naked and not lift a finger to lighten their condition. Then you have, successfully, gone where I cannot follow.
From Wikipedia, the free encyclopedia
Poverty in the United States refers to people living in poverty in the U.S. Within the U.S. the most common measure of poverty is the "poverty line" set by the U.S. government. The official poverty threshold is adjusted for inflation using the consumer price index. Poverty in the United States is cyclical in nature with roughly 12% to 16% living below the federal poverty line at any given point in time, and roughly 40% falling below the poverty line at some time within a 10 year time span.[1] While there remains some controversy of whether or not the official poverty over or understates poverty, the United States has some of the highest absolute and relative pre and post-transfer, poverty rates in the developed world.[2][3] Overall, the U.S. ranks 12th on the Human Poverty Index.[4]
Those under the age of 18 were the most likely to be impoverished. In 2006 the poverty rate for minors in the United States was the highest in the industrialized world, with 21.9% of all minors and 30% of African American minors living below the poverty threshold.[5] Moreover, the standard of living for those in the bottom 10% was lower in the U.S. than in any other developed nation except the United Kingdom, which had the lowest standard of living for impoverished children.[6]
Measures of poverty
Measures of poverty can be either absolute or relative.
The official measure of poverty
Percent and number below the poverty threshold.
[7]
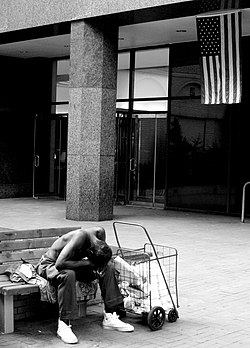
People who experience homelessness make poverty more visible in the United States.
There are two basic versions of the federal poverty measure: the poverty thresholds (which are the primary version) and the poverty guidelines. The Census Bureau issues the poverty thresholds, which are generally used for statistical purposes—for example, to estimate the number of people in poverty nationwide each year and classify them by type of residence, race, and other social, economic, and demographic characteristics. The Department of Health and Human Services issues the poverty guidelines for administrative purposes—for instance, to determine whether a person or family is eligible for assistance through various federal programs.[8]
Since the 1960s, the United States Government has defined poverty in absolute terms. When the Johnson administration declared "war on poverty" in 1964, it chose an absolute measure. The "absolute poverty line" is the threshold below which families or individuals are considered to be lacking the resources to meet the basic needs for healthy living; having insufficient income to provide the food, shelter and clothing needed to preserve health.
The "Orshansky Poverty Thresholds" form the basis for the current measure of poverty in the U.S. Mollie Orshansky was an economist working for the Social Security Administration (SSA). Her work appeared at an opportune moment. Orshansky's article was published later in the same year that Johnson declared war on poverty. Since her measure was absolute (i.e., did not depend on other events), it made it possible to objectively answer whether the U.S. government was "winning" this war. The newly formed United States Office of Economic Opportunity adopted the lower of the Orshansky poverty thresholds for statistical, planning, and budgetary purposes in May 1965.
The Bureau of the Budget (now the Office of Management and Budget) adopted Orshansky's definition for statistical use in all Executive departments in 1965. The measure gave a range of income cutoffs, or thresholds, adjusted for factors such as family size, sex of the family head, number of children under 18 years old, and farm or non-farm residence. The economy food plan (the least costly of four nutritionally adequate food plans designed by the Department of Agriculture) was at the core of this definition of poverty.[9]
The Department of Agriculture found that families of three or more persons spent about one third of their after-tax income on food. For these families, poverty thresholds were set at three times the cost of the economy food plan. Different procedures were used for calculating poverty thresholds for two-person households and persons living alone. Annual updates of the SSA poverty thresholds were based on price changes in the economy food plan.
Two changes were made to the poverty definition in 1969. Thresholds for non-farm families were tied to annual changes in the Consumer Price Index (CPI) rather than changes in the cost of the economy food plan. Farm thresholds were raised from 70 to 85% of the non-farm levels.
In 1981, further changes were made to the poverty definition. Separate thresholds for "farm" and "female-householder" families were eliminated. The largest family size category became "nine persons or more."[9]
Apart from these changes, the U.S. government's approach to measuring poverty has remained static for the past forty years.
Recent poverty rate and guidelines
The official poverty rate in the U.S. increased for four consecutive years, from a 26-year low of 11.3% in 2000 to 12.7% in 2004, then declined somewhat to 12.3% in 2006. This means that 36.5 million people were below the official poverty thresholds in 2006, compared to 31.1 million in 2000[10], and that there was an increase of 5.4 million poor from 2000 to 2006 while the total population grew by 17.5[citation needed] million. [11] The poverty rate for children under 18 years old increased from 16.2% to 17.8% from 2000 to 2004 and had dropped to 17.4% in 2005 and 2006. [12] The 2007-2008 poverty threshold was measured according to the HHS Poverty Guidelines[13] which are illustrated in the table below.
| Persons in Family Unit |
48 Contiguous States and D.C. |
Alaska |
Hawaii |
| 1 |
$10,400 |
$13,000 |
$11,960 |
| 2 |
$14,000 |
$17,500 |
$16,100 |
| 3 |
$17,600 |
$22,000 |
$20,240 |
| 4 |
$21,200 |
$26,500 |
$24,380 |
| 5 |
$24,800 |
$31,000 |
$28,520 |
| 6 |
$28,400 |
$35,500 |
$32,660 |
| 7 |
$32,000 |
$40,000 |
$36,800 |
| 8 |
$35,600 |
$44,500 |
$40,940 |
| For each additional person, add |
$3,600 |
$4,500 |
$4,140 |
SOURCE: Federal Register, Vol. 73, No. 15, January 23, 2008, pp. 3971–3972.
Relative measures of poverty
The poverty rate for selected age groups. Those under the age of 18 are most likely to fall below the poverty threshold.
[7]
Another way of looking at poverty is in relative terms. "Relative poverty" can be defined as having significantly less access to income and wealth than other members of society. Therefore, the relative poverty rate can directly be linked to income inequality. When the standard of living among those in more financially advantageous positions rises while that of those considered poor stagnates, the relative poverty rate will reflect such growing income inequality and increase. Conversely, the poverty rate can decrease, with low income people coming to have less wealth and income if wealthier people's wealth is reduced by a larger percentage than theirs. In 1959, a family at the poverty line had an income that was 42.64% of the median income. Thus, a poor family in 1999 had relatively less income and therefore relatively less purchasing power than wealthier members of society in 1959, and, therefore, "poverty" had increased. But, because this is a relative measure, this is not saying that a family in 1999 with the same amount of wealth and income as a family from 1959 had less purchasing power than the 1959 family.
In the EU, "relative poverty" is defined as an income below 60% of the national median equalized disposable income after social transfers for a comparable household. In Germany, for example, the official relative poverty line for a single adult person in 2003 was 938 euros per month (11,256 euros/year, $12,382 PPP. West Germany 974 euros/month, 11,688 euros/year, $12,857 PPP). For a family of four with two children below 14 years the poverty line was 1969.8 euros per month ($2,167 PPP) or 23,640 euros ($26,004 PPP) per year. According to Eurostat the percentage of people in Germany living at risk of poverty (relative poverty) in 2004 was 16% (official national rate 13.5% in 2003). Additional definitions for poverty in Germany are "poverty" (50% median) and "strict poverty" (40% median, national rate 1.9% in 2003). Generally the percentage for "relative poverty" is much higher than the quota for "strict poverty". The U.S concept is best comparable to "strict poverty". By European standards the official (relative) poverty rate in the United States would be significantly higher than it is by the U.S. measure. A research paper from the OECD calculates the relative poverty rate for the United States at 16% for 50% median of disposable income and nearly 24% for 60% of median disposable income[14] (OECD average: 11% for 50% median, 16% for 60% median).
The income distribution and relative poverty
Although the relative approach theoretically differs largely from the Orshansky definition, crucial variables of both poverty definitions are more similar than often thought. First, the so-called standardization of income in both approaches is very similar. To make incomes comparable among households of different sizes, equivalence scales are used to standardize household income to the level of a single person household. In Europe, the modified OECD equivalence scale is used, which takes the combined value of 1 for the head of household, 0.5 for each additional household member older than 14 years and 0.3 for children. When compared to the US Census poverty lines, which is based on a defined basket of goods, for the most prevalent household types both standardization methods show to be very similar.
Secondly, if the of the poverty threshold in Western-European countries is not always higher than the Orshansky threshold for a single person family. The actual Orchinsky poverty line for single person households in the US ($9645 in 2004) is very comparable to the relative poverty line in many Western-European countries (Belgium 2004: ˆ9315), while price levels are also similar. The reason why relative poverty measurement causes high poverty levels in the US, as demonstrated by Förster[14], is caused by distributional effects rather than real differences in wellbeing among EU-countries and the USA. The median household income is much higher in the US than in Europe due to the wealth of the middle classes in the US, from which the poverty line is derived. Although the paradigm of relative poverty is most valuable, this comparison of poverty lines show that the higher prevalence of relative poverty levels in the US are not an indicator of a more severe poverty problem but an indicator of larger inequalities between rich middle classes and the low-income households. It is therefore not correct to state that the US income distribution is characterised by a large proportion of households in poverty; it is characterized by relatively large income inequality but also high levels of prosperity of the middle classes. The 2007 poverty threshold for a three member family is 17,070.
Human Poverty Index
The United Nations Development Programme, uses the human poverty index in order to assess the development with regards to poverty among OECD countries. The index takes the likelihood of a child not surviving to age 60, functional illiteracy rate, long-term unemployment and the population living on less than 50% of the median national income into account. While the United States has one of the second lowest long-term unemployment rates in the developed world, it has the highest percentage of children who are not likely to live to age 60 and persons living on less than 50% of the national median income and the third highest percentage of adults lacking functional literacy skills.
| Ranking |
Country |
HPI-2 |
Probability at birth
of not surviving
to age 60 (%) |
People lacking functional
literacy skills (%) |
Long-term
unemployment (%) |
Population below 50%
of median income (%) |
| 1 |
Sweden |
6.5 |
7.2 |
7.5 |
1.0 |
6.5 |
| 2 |
Norway |
7.0 |
8.4 |
7.9 |
0.4 |
6.4 |
| 3 |
Netherlands |
8.2 |
8.7 |
10.5 |
2.5 |
7.3 |
| 4 |
Finland |
8.2 |
9.7 |
10.4 |
2.1 |
5.4 |
| 5 |
Denmark |
8.4 |
10.4 |
9.6 |
1.3 |
- |
| 6 |
Germany |
10.3 |
8.8 |
14.4 |
5.0 |
8.3 |
| 7 |
Switzerland |
10.7 |
7.8 |
15.9 |
1.6 |
7.6 |
| 8 |
Canada |
10.9 |
8.1 |
14.6 |
0.7 |
11.4 |
| 9 |
Luxembourg |
11.1 |
9.7 |
- |
1.2 |
6.0 |
| 10 |
France |
11.4 |
9.8 |
- |
4.3 |
8.0 |
| 11 |
Japan |
11.7 |
7.1 |
- |
1.5 |
11.8 |
| 12 |
Belgium |
12.4 |
9.4 |
18.4 |
4.3 |
8.0 |
| 13 |
Spain |
12.6 |
8.7 |
- |
3.0 |
14.3 |
| 14 |
Australia |
12.8 |
7.7 |
17.0 |
0.9 |
14.3 |
| 15 |
United Kingdom |
14.8 |
8.7 |
21.8 |
1.1 |
12.4 |
| 16 |
United States |
15.4 |
11.8 |
20.0 |
0.6 |
17.0 |
| 17 |
Ireland |
16.1 |
8.7 |
22.6 |
1.5 |
16.5 |
| 18 |
Italy |
29.9 |
7.8 |
47.0 |
4.0 |
12.7 |
Other international comparisons
Food security
Eighty-nine percent of American households were food secure throughout the entire year 2002, meaning that they had access, at all times, to enough food for an active, healthy life for all household members. The remaining households were food insecure at least some time during that year. The prevalence of food insecurity rose from 10.7% in 2001 to 11.1% in 2002, and the prevalence of food insecurity with hunger rose from 3.3% to 3.5%.[15]
Causes of poverty

People experiencing
homelessness living in cardboard boxes in Los Angeles, California where the median home price was estimated to be $564,430 in May 2006.
There are numerous perceived direct and indirect causes of poverty in the United States. They include:
- Unfavorable economic conditions
- Mental illness and disability
- Lack of educational attainment and skill
- Substance abuse
- Birth of a child
- Domestic abuse
- Natural or other disasters
- Tax levels Cross-country data shows a correlation between tax levels as a share of GDP and child poverty. [16]
- Crime
- A survey done by Michigan State University found that a slight majority of American households with annual incomes of $70,000 or more believed that the two principal problems of poverty are lack of work ethic and a minimum wage that is too low.
- Institutional racism: The gross disparities among impoverished people in the United States along racial lines have led many to speculate historic and/or ongoing institutional racism is responsible for much of the poverty in the United States today.
- However, others have claimed that poverty is caused by illegitimacy, and not by racism. For example, in a February 7, 2008 column, African American economist Thomas Sowell wrote, "The poverty rate among black married couples has been in single digits since 1994."[17]As another example, in a January 15, 2003 article titled "How Not to Be Poor," Blake Bailey wrote, "Don't Have Children Out of Wedlock... Children born to parents who do not marry spend, on average, 56.7 percent of their lives in poverty as opposed to just 6.3 percent for children in married families." [18] In 2005, African American economist Walter E. Williams, of George Mason University, wrote:
| “ |
Let's examine some numbers readily available from the Census Bureau's 2004 Current Population Survey... There's one segment of the black population that suffers only a 9.9 percent poverty rate, and only 13.7 percent of its under-5-year-olds are poor. There's another segment that suffers a 39.5 percent poverty rate, and 58.1 percent of its under-5-year-olds are poor. Among whites, one segment suffers a 6 percent poverty rate, and only 9.9 percent of its under-5-year-olds are poor. The other segment suffers a 26.4 percent poverty rate, and 52 percent of its under-5-year-olds are poor... The only distinction between both the black and white populations is marriage — lower poverty in married-couple families. [19] |
” |
- Limited job opportunities appear to exist for significant subgroups of some races and ethnic groups. This is reflected by the low-income nature of large sections of the economy, as divided along racial/ethnic lines: 21% of all children in the United States live in poverty, but 46% of African American children and 40% of Latino children live in poverty.[20]
- Region. Many rural areas, especially in the South and Appalachia have a high poverty rate due to limited job opportunities, and historical issues.
- The Heritage Foundation speculates that illegal immigration increases job competition among low wage earners, both native and foreign born. Additionally many first generation immigrants, namely those without a high school diploma, are also living in poverty themselves.[21]
Sociological causes
Much poverty in the United States is the result of social institutions which contribute to and sustain poverty. [22] In particular, low quality education from poorly funded inner-city schools results in few marketable skills which leads to low-wage jobs which leads to less ability to pay for housing, food, clothing, medical care which leads to bad neighborhoods and further funding problems for schools, as well as less exposure to positive role models, and increased risk of serious illness. Racial and ethnic discrimination feed into these barriers.
Poverty is also the product of deindustrialization. As the U.S. shifts from a manufacturing, industrial society to a service-oriented, high-tech society, many of the blue-collar jobs that required little education but paid well are disappearing or being outsourced.[22] Rural areas, such as Appalachia, suffer losses of mining jobs, and cities such as Detroit lose many manufacturing jobs to automation or overseas factories. Some people are unable to follow the jobs or commute to work are left in neighborhoods without employment or tax-basis to support needed social functions, such as schools, public transportation, police departments, etc. Others simply cannot find jobs because of the shift towards a service-based economy; in economic terms these people are structurally unemployed due to the changing skills needed.
Controversy
There has been significant disagreement about poverty in the United States; particularly over how poverty ought to be defined. Using radically different definitions, two major groups of advocates dispute whether or not more resources are needed to help lessen poverty. Liberals consistently claim that more resources are needed to alleviate poverty. Conservatives often argue that the condition of the poor does not presently require more resources but rather an allocation that encourages a temporary dependence upon the American social safety net.
Much of the debate about poverty focuses on statistical measures of poverty and the clash between advocates and opponents of welfare programs and government regulation of the free market. Since measures can be either absolute or relative, it is possible that advocates for the different sides of this debate are basing their arguments on different ways of measuring poverty. It is often claimed that poverty is understated, yet there are some who also believe it is overstated; thus the accuracy of the current poverty threshold guidelines is subject to debate and considerable concern.
A 2006 study published in the Washington Times showed how many of the appliances modern middle class and working class households take for granted are lacking in poverty stricken households. Among the households constituting the bottom ten percent, 36% were lacking microwave ovens, 53% were lacking clothes dryers and 79% were lacking a computer. Furthermore only 19% were in possession of a garbage disposal and only 23% owned a dishwasher. Color televisions, VCRs, and stereos were among the more commonly found mundane appliances with 91% of households in the bottom ten percent owning a color television, 55% owning a VCR, and 42% owning a stereo.[23]
However, as noted in "EU versus USA", only 11% of those in the general UK population own a dishwasher, and the penetration rate of microwave ovens in the EU is generally well under 30% [24]. The report goes on to note that 46% of poor households in the US own their own home, and 30% have two or more cars, and 63% have cable or satellite TV.
Concerns regarding accuracy
In recent years, there have been a number of concerns raised about the official U.S. poverty measure. In 1995, the National Research Council's Committee on National Statistics convened a panel on measuring poverty. The findings of the panel were that "the official poverty measure in the United States is flawed and does not adequately inform policy-makers or the public about who is poor and who is not poor."
The panel was chaired by Robert Michael, former Dean of the Harris School of the University of Chicago. According to Michael, the official U.S. poverty measure "has not kept pace with far-reaching changes in society and the economy." The panel proposed a model based on disposable income:
| “ |
According to the panel's recommended measure, income would include, in addition to money received, the value of non-cash benefits such as food stamps, school lunches and public housing that can be used to satisfy basic needs. The new measure also would subtract from gross income certain expenses that cannot be used for these basic needs, such as income taxes, child-support payments, medical costs, health-insurance premiums and work-related expenses, including child care.[25] |
” |
Understating poverty
Many sociologists and government officials have argued that poverty in the United States is understated, meaning that there are more households living in actual poverty than there are households below the poverty threshold.[26] A recent NPR report states that as much as 30% of Americans have trouble making ends meet and other advocates have made supporting claims that the rate of actual poverty in the US is far higher than that calculated by using the poverty threshold.[26] The issue of understating poverty is especially pressing in states with both a high cost of living and a high poverty rate such as California where


